Project #6
ATMOSLOG
AtmosLog is an environmental monitoring system that combines real-time temperature and humidity tracking with data visualization and logging. Utilizing a DHT11 sensor, a TFT LCD display screen, an HC04 ultrasonic sensor, and an SD card module, it measures environmental data every two seconds, displaying it on the TFT screen, logging it to an SD card, and transmitting it via Bluetooth. Python integration adds a dynamic edge by generating live graphs that update in real time, visualizing data trends
Technical Breakdown

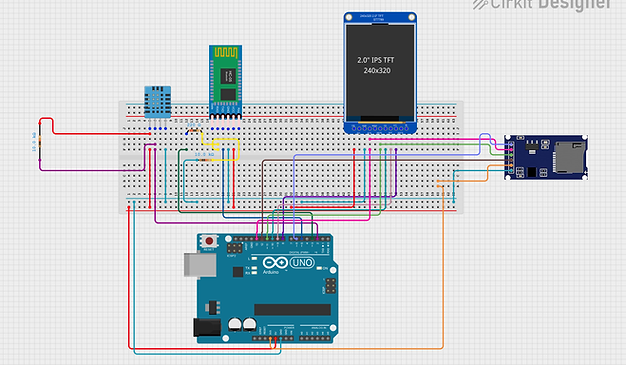
Schematic Diagram
Components Used:
1. Arduino UNO Board
2. DHT 11 Temperature and Humidity Sensor
3. HC 05 Bluetooth Module
4. SD Card Module
5. SDHC 16GB Micro SD Card
6. Samsung Micro SD Card Adapter
7. ST7735 1.8" TFT LCD
8. 220Ω Resistors x 1
9. 10kΩ Resistors x 2
10. Jumper wires
Key Features
1. Temperature & Humidity Measurements
The DHT11 sensor is crucial to measuring accurate readings of the surrounding environment every two seconds. It gauges exactly the temperature and relative humidity of the environment and the data is sent for processing and storage
2. Real-Time Display
The system saves all environmental data to a microSD card, enabling users to review and analyze historical records. This feature makes the project ideal for long-term monitoring and trend analysis.
3. Bluetooth Transmission
Using the HC05 Bluetooth module, AtmosLog streams live data directly to paired devices. This allows users to conveniently access real-time updates through a Bluetooth terminal on their smartphones or computers.
4. Data Logging
A Python script processes the transmitted data to generate an interactive graph. This graph updates every two seconds, providing a visual representation of changes in temperature and humidity over time.
5. Live Graphing
A Python script processes the transmitted data to generate an interactive graph. This graph updates every two seconds, providing a visual representation of changes in temperature and humidity over time.
Demonstration Video
In the demo I walk through in detail the processes behind AtmosLog. I begin with a brief introdution, where I outline the components used in the project. I then move on to a more explanatory overview of the components used and their funtion in the project. I demonstrated the logging of data via a paired bluetooth device and then I showed the live-graph plotting capabilities of the project, observing the effect of spraying an areosol on the ambient temperature and humidity. I cap the video off with an analysis of the devices' schematic diagram where I go in-depth into explaining how the components are interconnected in the project's circuit board.
Demonstrating the Real-time Measuring and Data Logging Capabilities of AtmosLog.
*the demo video may be temporarily unavailable
Notes
Integrating all the different sensors and modules into AtmosLog was one of the most complex challenges I've taken on so far. The combination of a DHT11 temperature and humidity sensor, an ultrasonic sensor, an SD card module, a TFT LCD display, and Bluetooth communication required very careful wiring, troubleshooting, and code optimization. Each component had its own quirks, and ensuring they all worked together smoothly took quite a lot of debugging. Despite the challenges, it was an incredibly fun learning experience that deepened my understanding of real-time data logging and visualization.
One particularly frustrating hurdle was getting the SD card module to function correctly. Even when the code was perfectly fine, the module just refused to cooperate at times for no clear reason. After multiple tests, rewiring, and trying different SD cards, I finally got it working consistently. This experience reinforced how unpredictable hardware can be and the importance of patience when debugging seemingly random and unforseeable issues.
On the other hand, adapting my Bluetooth code from the PyroSafe Monitoring System was surprisingly smooth. Since I had already implemented a similar setup from my previous project, the PyroSafe Monitoring System, I was able to modify the code quickly to transmit temperature and humidity data via Bluetooth.
However, the biggest roadblock came when trying to generate a live Python graph of the data. My initial plan was to receive the sensor readings over Bluetooth on my laptop and generate the graph in real-time. But after trying different serial terminal applications, tweaking my Bluetooth drivers, and making several code adjustments, the data still wasn’t being received properly. Ultimately, I had to switch to using the USB connection instead, which worked flawlessly.
There’s definitely room for improvement and future upgrades. One of my main goals is to replace the Bluetooth functionality with WiFi, allowing the data to be sent directly to a mobile application. This would enable a more customizable UI and a more intuitive way to view the logged data. Additionally, I’d like to improve the overall design by integrating a PCB to make the setup more compact and professional-looking.
Overall, I'm really proud of this project. Working with a TFT LCD screen was a valuable experience, and I learned key electronics concepts like using pull-up resistors to prevent floating pins, reducing electromagnetic interference, and voltage division.
Another milestone was successfully recording a full demo video and launching my YouTube channel to showcase my projects. Creating a clear and engaging demonstration was just as important as building the project itself.
Check out my other projects here!

